2022 Southwest Airlines “meltdown”

Note: If you have questions or comments about the dataset used here, do not hesitate to contact me. You will find my email on my personal website.

The so-called “Southwest meltdown” happened this week as severe winter weather hit most of the US. Thousands of flights got canceled, making tens or even hundreds of thousands of people unhappy. Southwest operates primarily as a low-cost carrier, offering a no-frills experience with a focus on low fares. This implies a different way of operating connections. There is no central hub, and airplanes constantly fly to different locations. It turns out that this model is vulnerable when multiple airports get disrupted. There is a ton of resources and articles on this topic. I want to focus on how the “meltdown” is visible in my data.

Individual airlines

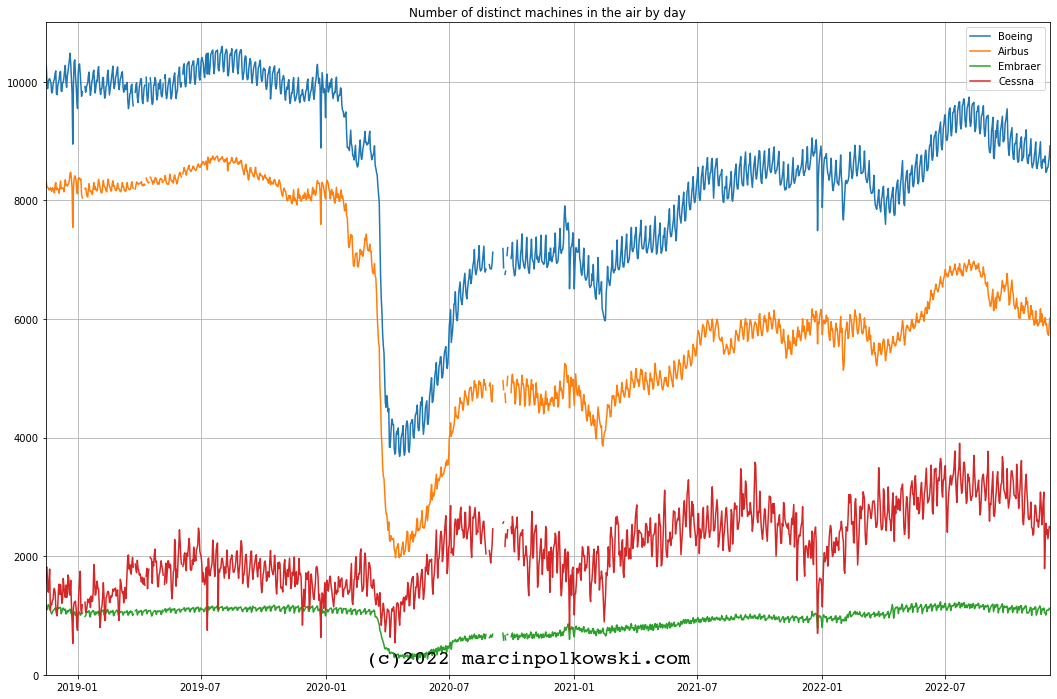
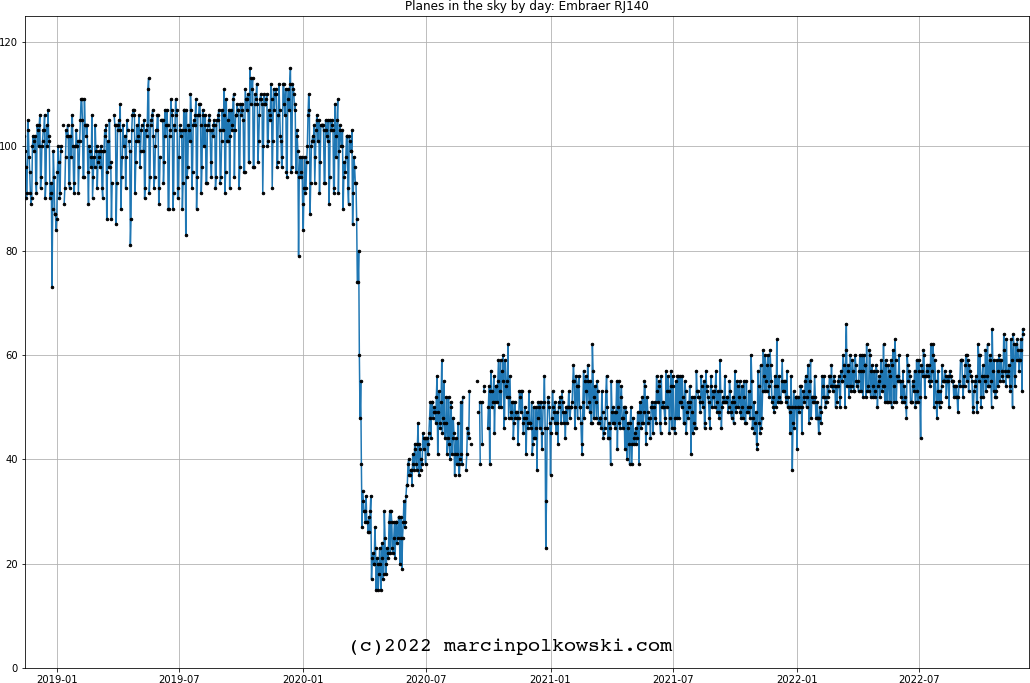
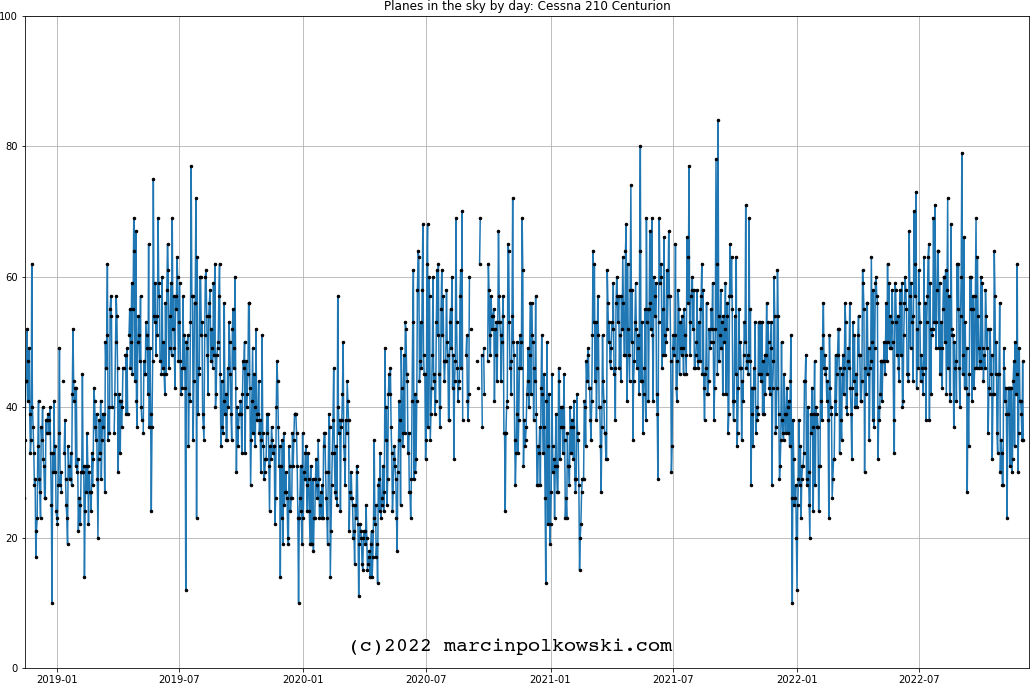
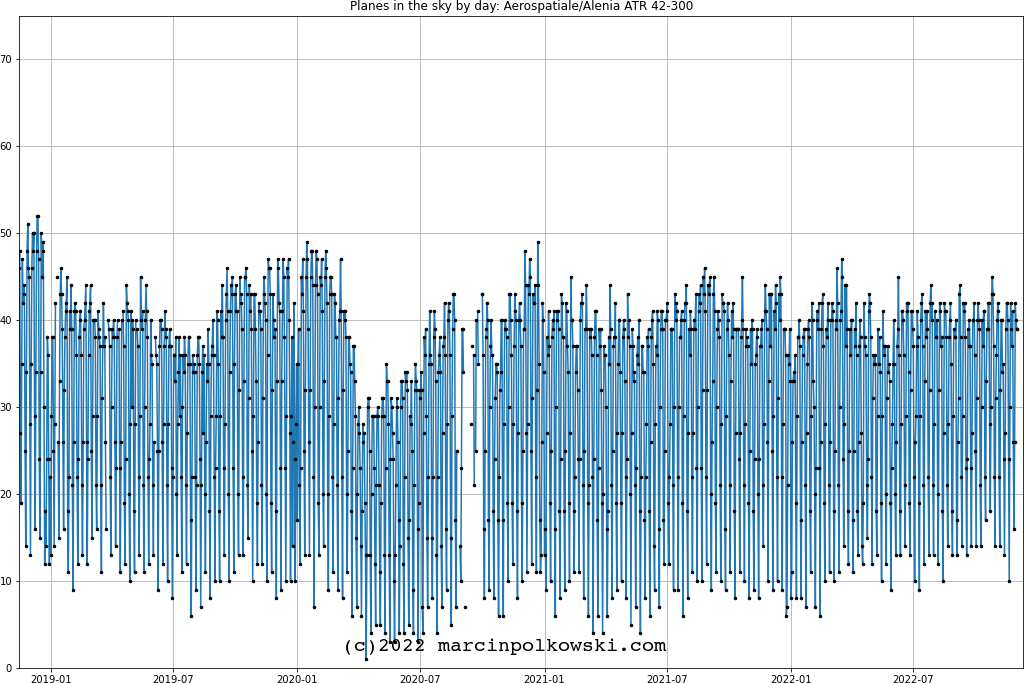
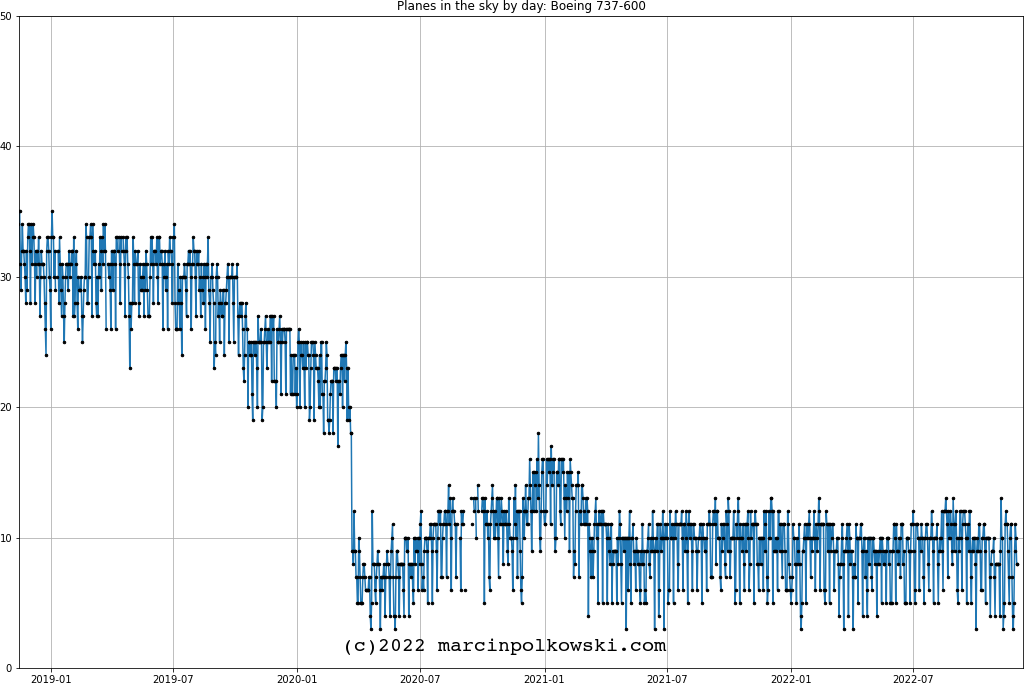
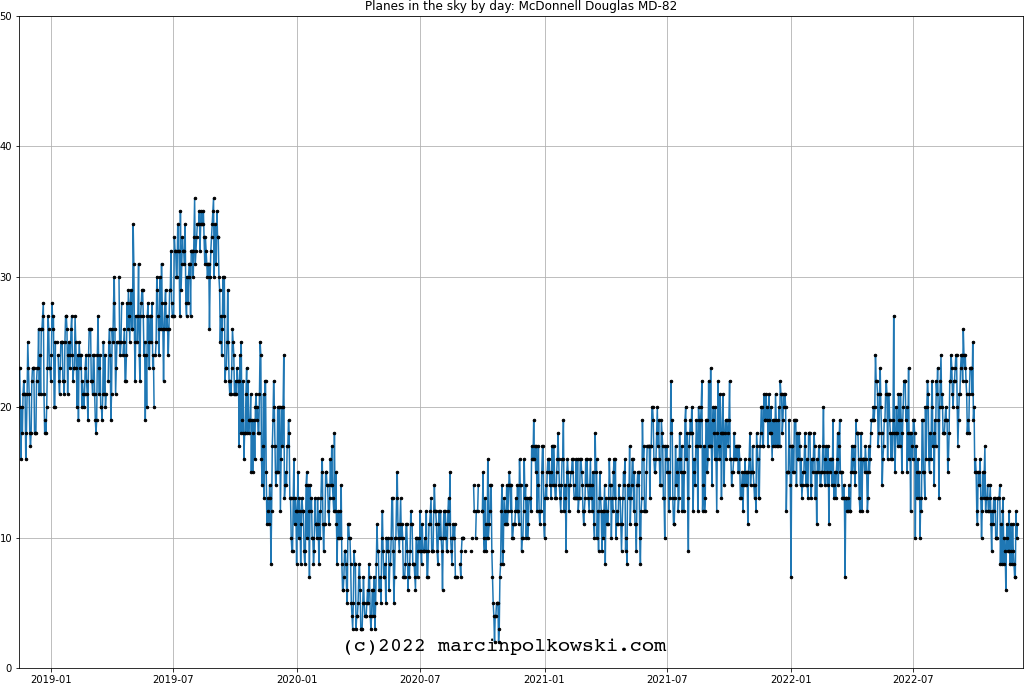
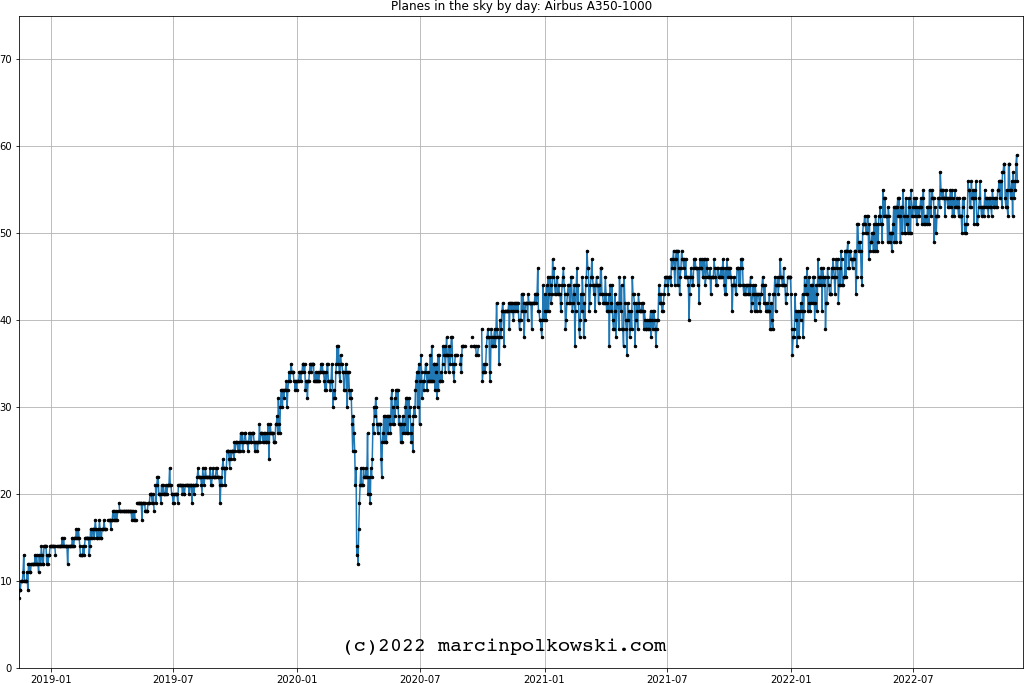
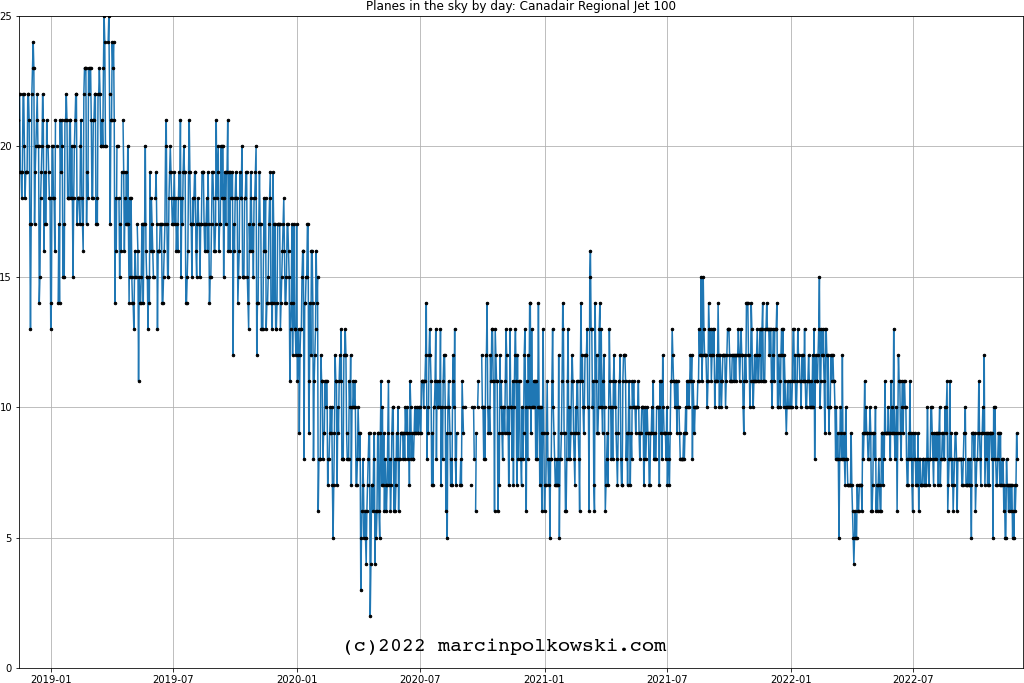
Let’s look at the number of airplanes (distinct machines) [blue line] and the number of flights (the same aircraft serves multiple connections every day) by day [green line]. Let’s look at the past four years and two months.

Thin, red vertical lines on the right-hand side plots show Thanksgiving and two Christmas Days.

Southwest Airlines

Interestingly, the 2022 “meltdown” brought the number of connections below the minimum numbers from the “2020 Covid Lockdown”.

American Airlines

United Airlines

Bonus: Lufthansa

This post is focused on the USA, but Lufthansa is the airline that I use the most (yeah, you can call it my favorite one). What is interesting here is the two significant dips in the number of connections in the second half of 2022. On these two days, Lufthansa personnel was on strike.

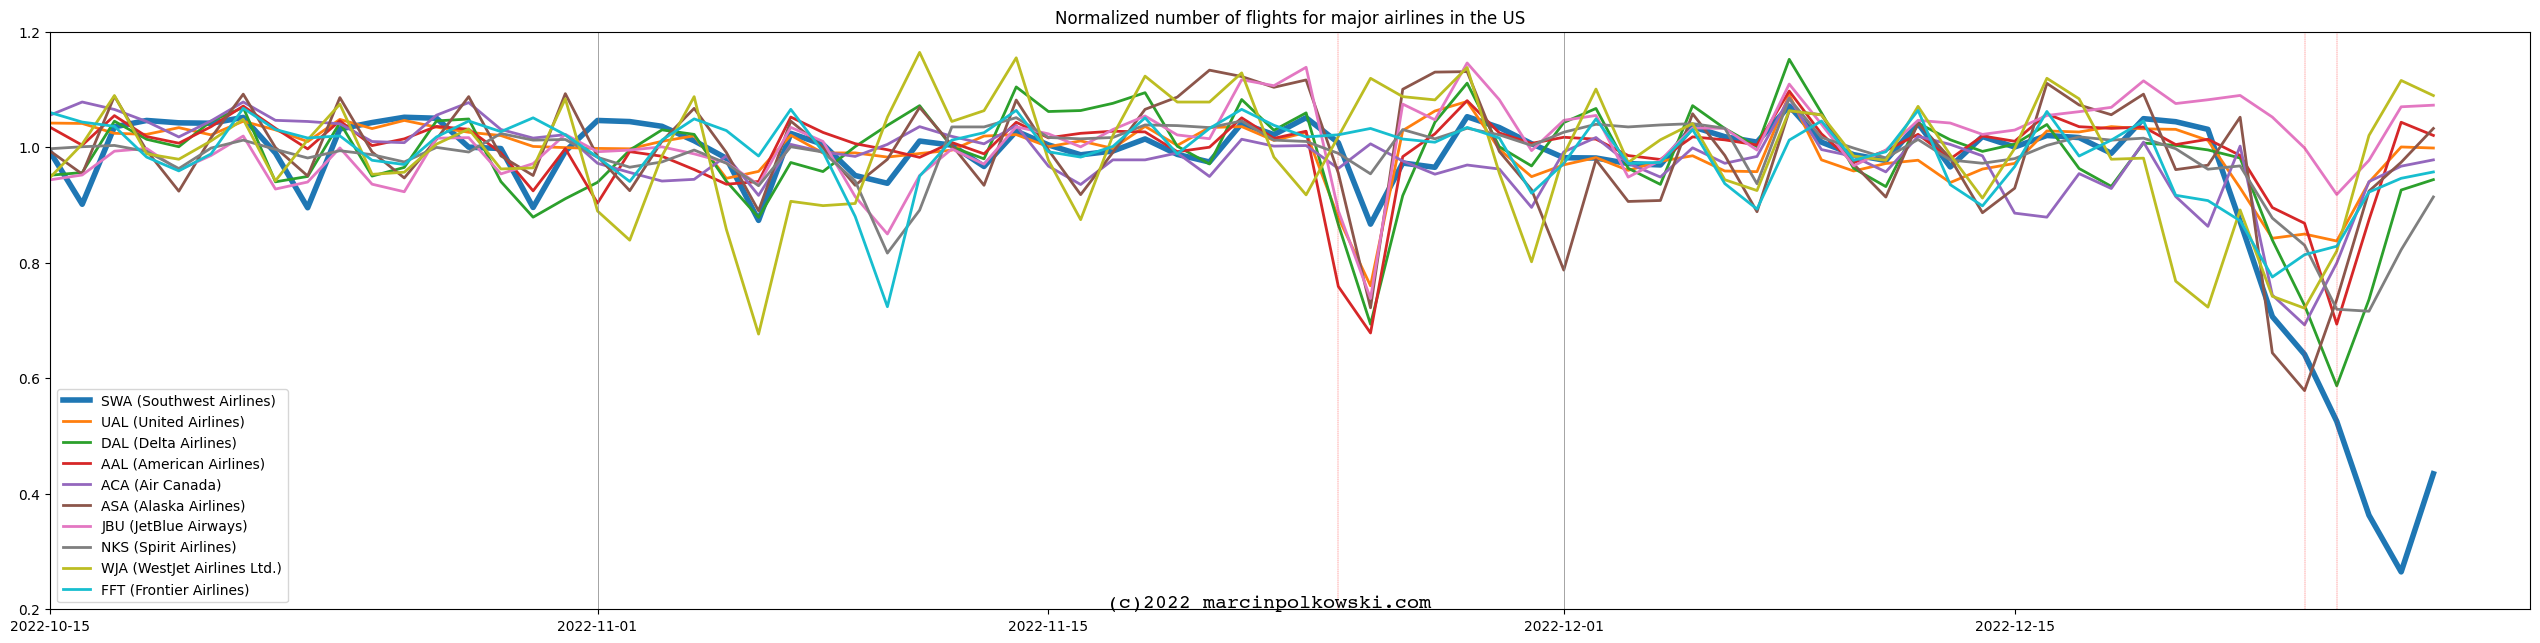
Major North America airlines – comparison

Let’s look at ten major airlines in North America. We are looking (below) at the number of daily connections/flights normalized to the average for the period between October 15th and December 15th. You can see that across all airlines, Thanksgiving weekend and Christmas are slower than “usual”, but after this Christmas (while all airlines returned to regular operation), Southwest plunged to around 30% of its normal operation.


Summery

Data is fun, let me know if you like it too!

| comments

Counting airplanes throughout the Pandemic

Note: If you have questions or comments about the dataset used here, do not hesitate to contact me. You will find my email on my personal website.

As I mentioned a a few months ago I’ve been collecting flight statistics for over 4 years. It happened that these 4 years were the most interesting in the industry ever. 2022 is the year when the travel demand is back to normal, but the airlines struggle with supply, because of the cuts they made in 2020/2021 to survive.

Depending on the country and region, people were living in lockdowns and countries were banning local and international travel. I think I don’t need to explain that to anyone.

On top of the Pandemic, we were witnessing events influencing individual airplane models. One of the examples of such events was the retirement of Airbuses A380 because they were too big. Some airlines now work hard to bring them back (ex. Lufthansa announced to bring back four A380s in 2023).

In the meantime, we had two catastrophes of Boeing’s 737 MAX-8 that grounded all of them for many months.

A few weeks ago Boeing produced the last 747 – one of the most recognizable planes in history. I created most of the content for this article while onboard 747 – my symbolic tribute to this great plane. I had the pleasure of traveling on both the lower and upper decks of this plane, however, I still hope that one day I will be able to get the First Class ticket that allows sitting “in front of the pilot” – a pretty unique thing.

Ok, let’s get to the data! I used my huge dataset to calculate the number of airplanes (unique machines), by model and date. Let me show you the most interesting results:

Boeing 737 MAX-8

On October 29, 2018, Lion Air Flight 610, a 737 MAX 8, plunged into the Java Sea 13 minutes after takeoff from Soekarno–Hatta International Airport, Jakarta, Indonesia. On March 10, 2019, Ethiopian Airlines Flight 302, a 737 MAX 8, crashed approximately six minutes after takeoff from Addis Ababa, Ethiopia. This second crash (marked as a red vertical dashed line) caused all MAX-8s to be grounded. It took almost 2 years before these planes were allowed back in the air. This model is constantly produced and sold, hence the growing number of planes in time.

Boeing, Airbus, Embraer, and Cessna VS the Pandemic

If we look at results consolidated by plane manufacturers we can see how differently the Pandemic affected commercial airliners (Boeing, Airbus, Embraer) and private planes (Cessna). I do realize that I generalize here the distinction between commercial and private.

Most popular models vs the Pandemic

Let’s look at the selection of popular planes and their counts in the air during the Pandemic. This plot is normalized: for each plane model, 1 on the y-axis is corresponding to the average number of planes a day before January 1st, 2022. We can see that the different models were “hit” differently by the Pandemic, but all of them still struggle to get back to “pre Pandemic” counts.

Individual airplanes

In case you are interested in other examples, I’m sharing plots for most airplane models. I encourage you to take a look and let me know if you found anything interesting.

| comments

How to calculate the value of the biggest prime we know?

I hope that I don’t need to introduce prime numbers to anyone. They are fascinating for all mathematic enthusiasts. We know a lot of prime numbers, but we have no formula to calculate them. Search for the biggest primes is an ongoing competition. People are looking for the biggest primes among the so-called Mersenne Primes. Mersenne Primes are primes that can be expressed as 2n-1. The record is currently held by 282,589,933−1 with 24,862,048 digits, found by GIMPS in December 2018 (more on Wikipedia).

We can find a value of 282,589,933-1 online (for example beginning and the end of the number on Wikipedia linked above). But what if we would like to calculate the value ourselves? We have multiple options. For the sake of this article, I selected 2:

bc – an arbitrary precision calculator language

bc is a linux/unix command line calculator that supports arbitrary precision:

We can run the following in the terminal to calculate the value of 282,589,933-1. We use tr and sed to pack the result in one line.

echo "Testing BC:"
time echo "2^82589933-1" \
    | bc \
    | tr "\n" " " \
    | sed 's/\\ //g' \
    > bc.txt


Since the calculation is not trivial the answer is not coming instantaneously. On my 2021 MacBook pro with M1 Max processor it took 30 minutes to get the result: >24 megabytes of digits.

Python

Yes, Python! Python supports arbitrary precision integers by default. There is a slight complication that was added recently for security reasons: we need to increase the default length of the number that can be converted to a string. Let’s consider the following code:

import sys
sys.set_int_max_str_digits(int(3e7))

number = 82589933

print(2**number-1, end=' ')

And run it in the terminal:

echo "Testing Python":
time python python.py > python.txt

It takes python almost 3 hours to compute the result.

Results

Finally, we can confirm that both results are the same:

echo "Comparing Results":
shasum bc.txt
shasum python.txt

Which should give result as following:

Comparing Results:
9abebcdaf11efd28f1797d6b2744cbcb0cc66e52  bc.txt
9abebcdaf11efd28f1797d6b2744cbcb0cc66e52  python.txt

Summary

If you ever need to calculate integers bigger then 64 or 128 bits, now you know how.

| comments

Passion for data and plane travel

I’m very enthusiastic about both data science and plane travel. I found a way of combining these two passions. It stared from my frequently visiting flight tracking websites like adsbexchange.com or flightradar24.com. The next step for me was to build my own ADS-B receiver using Raspberry Pi. I stared with small antenna by the windows and quickly changed my setup to use big antenna on the top of my house. My Raspberry collects and shares data for over 8 years now (that reminds me, that I’ve never updated it). It receives signals from planes as far as 250 miles from my house. I’ve done some interesting data science using this data, but quickly realized that I’m hungry for more data.

Over 4 years ago I had an idea to start collecting data about all planes around the globe and storing it in the database for future science. I spend time searching for data sources, designing the database and all related processes and finally started collecting data. I started collecting data in November 2018.

Today, almost 4 years later I have a decent database to play with. The database is over 16 billion rows (1.6e10) and occupies almost 3 TB of disk space. I’m using Google BigQuery to store the data ans Docker to run the whole related infrastructure.

I’m going to share some of the most interesting analysis I was able to do with this data. I hope you will find it interesting and maybe even useful. Stay tuned!

| comments

GMT (Generic Mapping Toolbox) in Docker

GMT (Generic Mapping Toolbox) is a very powerful tool for making maps. It is primarily a command line tool that creates Post Script files (yes, sound like very old times, but still powerful). It is available from the GMT website. GMT was created and is still maintained by Paul Wessel at the University of Hawai’i at Mānoa. My first GMT experience dates back to ~2010, when I was a Masters student.

Fun Fact: In mid 2010s I applied for Post Doc postion at the University of Hawai’i at Mānoa. I was very excited about the opportunity to work with Paul Wessel. Unfortunately, I didn’t get the position, but it was close!

I recently decided to try GMT again, and to save time on installation and configuration I decided to use Docker. I tried to find ready to use container with GMT, but finally decided to create my own. I’m sharing my Dockerfile and instructions on GitHub: https://github.com/gozwei/gmt-docker.

I’m going to use this container to create maps for my blog. I’m going to share the code and maps in the future posts. Stay tuned!

Quick usage instructions:

I will assume that you have Docker installed on your computer. If not, please follow the instructions on the Docker website.

Clone to repository and build the container:

        
docker build -t gmt:6.4.0 .
        

Create an alias (optional, recommended if you are using Linux or MacOS – have no idea how to do that on Windows):

        
alias gmt-docker='docker run --rm -v "$PWD/:/root/work/" -i -t gmt:6.4.0'
        

This will allow you to use the container anywhere on your computer – this is useful, because you need to map your current directory to the container to use it.

Now you can use the container. For example, to create a map of the USA you can use the following commands:

        
gmt-docker gmt set FONT_ANNOT_PRIMARY 5p,Helvetica
gmt-docker gmt psbasemap -R-128/-65/24/51 -Jl-96.5/40/23/52/1:40000000 -B10g2 -K -P > USA.ps
gmt-docker gmt pscoast -R -Df -Ia/0.03p,black -J -N1/0.5p -N2/0.25p,- -G#dde6d5 -S#a5bfdd -A0/0/4 -W0.5p,black -O -P >> USA.ps
gmt-docker convert -geometry 2048x2048 -density 600 -background white -flatten -trim +repage USA.ps USA.png
        

This will create a map of the USA and save it as USA.png. The map will look like this:

Disclaimer: The purpose of this post is not to teach GMT or Docker. I’m just sharing my experience with these tools. If you want to learn more about GMT, please visit the GMT website. If you want to learn more about Docker, please visit the Docker website. I just hope I can make your journey with these tools a little bit easier.

I hope you will find this useful. If you have any questions, please let me know in the comments.

| comments

Older posts »